Main dashboard
The following sections are a guide on the different sections of the main Network Analytics dashboard.
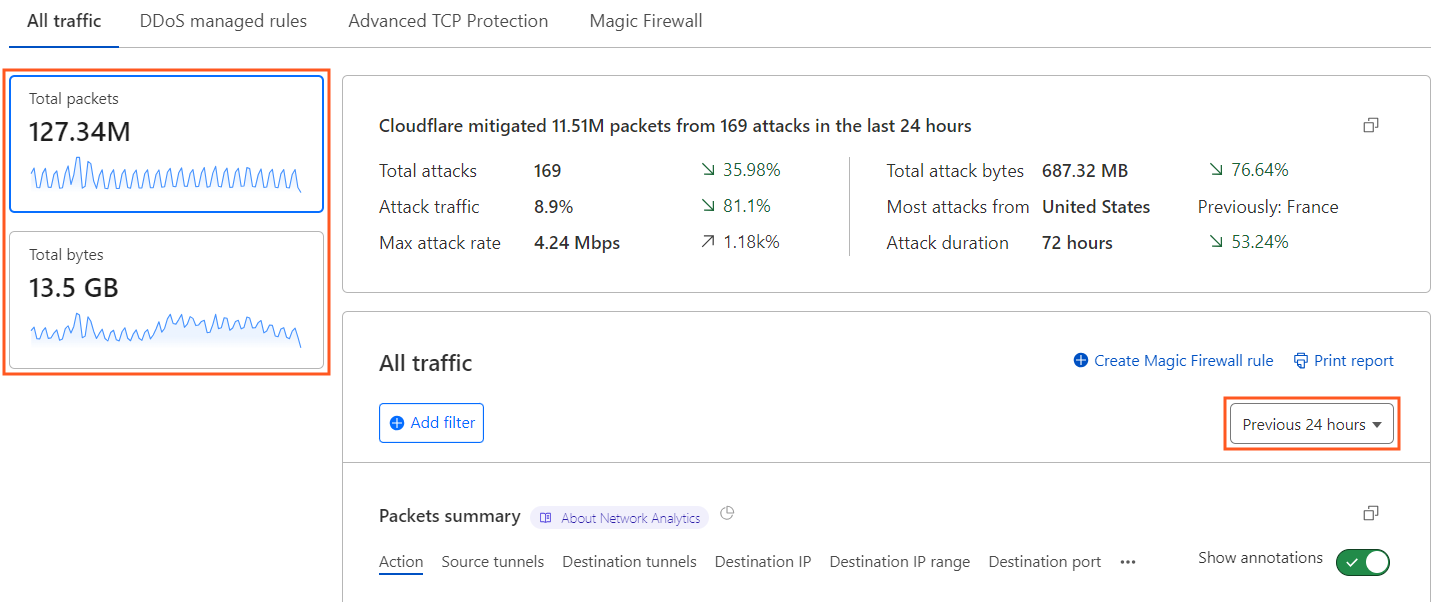
Available tabs
The All traffic tab displays global information about layer 3/4 traffic and DDoS attacks.
The dashboard has additional tabs with specific information (and specific filters) for different layer 3/4 mitigation systems:
- DDoS managed rules: Shows only traffic dropped and passed by DDoS managed rules.
- Advanced TCP Protection: Shows traffic dropped and passed by the Advanced TCP Protection system. Does not include traffic dropped by DDoS managed rules.
- Magic Firewall: Shows traffic dropped by Magic Firewall and the traffic passed to the origin server. Does not include traffic dropped by DDoS managed rules or the Advanced TCP Protection system.
Use these tabs to better understand the decisions made by each mitigation system, and which rules are being applied to mitigate attacks.
High-level metrics
The side panels in the Network Analytics page provide a summary of activity over the period selected in the timeframe drop-down list.
Selecting one of the metrics in the sidebar will define the base unit (packets or bits/bytes) for the data displayed in the dashboard.
Filters
In the main dashboard card you can apply filters to the displayed data.
You can filter by the following parameters:
- Mitigation action taken by Cloudflare
- Mitigation system that performed the action
- Source IP, port, ASN, tunnel
- Destination IP, port, IP range (description or CIDR of provisioned prefixes), tunnel
- Source Cloudflare data center and data center country of where the traffic was observed
- Packet size
- TCP flag
- TTL
Packets summary or Bits summary
Displays a plot of the traffic (in terms of bits or packets) in the selected time range according to the values of a given dimension. By default, Network Analytics displays data broken down by Action.
Available dimensions
You can choose one of the following dimensions:
- Action
- Destination IP
- Destination IP range
- Destination port
- Destination tunnels
- Mitigation system
- Source ASN
- Data center country
- Source data center
- Source IP
- Source port
- Source tunnels
- Packet size
- Protocol
- TCP flag
Mitigation system distribution
The Mitigation System Distribution card displays the amount of traffic (in terms of packets or bits) that was mitigated by each mitigation system.
Packet sample log
The Network Analytics Packet sample log shows up to 100 log events — including both allowed and dropped packets — in the currently selected time range, paginated with 10 results per page per time range view (the GraphQL Analytics API does not have this limitation).
Expand each row to display event details, including the full packet headers and metadata.
Dashboard tabs for specific mitigation systems (DDoS managed rules, Advanced TCP Protection, or Magic Firewall) may have additional fields in the expanded event details. Data center country/Source data center
Displays the top source Cloudflare data centers where the displayed traffic was ingested. The same card can also display the country associated with these top source data centers.
To switch between Data center country and Source data center information, use the dropdown in the card.
Top insights
The different panels in Top insights display the top items in each dimension. To filter by a given value or exclude a value from displayed data, hover the value stats and select Filter or Exclude.
To set the number of items to display for each dimension, open the drop-down list associated with the view and select the desired number of items.
TCP flag
The TCP Flag panel displays the TCP flags set for all the traffic currently displayed in the dashboard, including both allowed and mitigated traffic.