Install the Cloudflare Grafana Plugin
Overview
Installing the Cloudflare Grafana Plugin takes under 5 minutes and is the best way to start exploring your DNS analytics from Cloudflare. The Cloudflare Grafana plugin currently includes DNS and Virtual DNS analytics, and over time will be expanded to include other HTTP and Firewall data.
Requirements
This is a very specific use case that requires that:
- You have configured DNS Firewall;
- You have a Full Setup
Otherwise, it won’t collect any data here.
How to install
1. First you will need to have a running version of Grafana.
2. Next use the Grafana CLI to install the Cloudflare plugin.
grafana-cli plugins install cloudflare-app
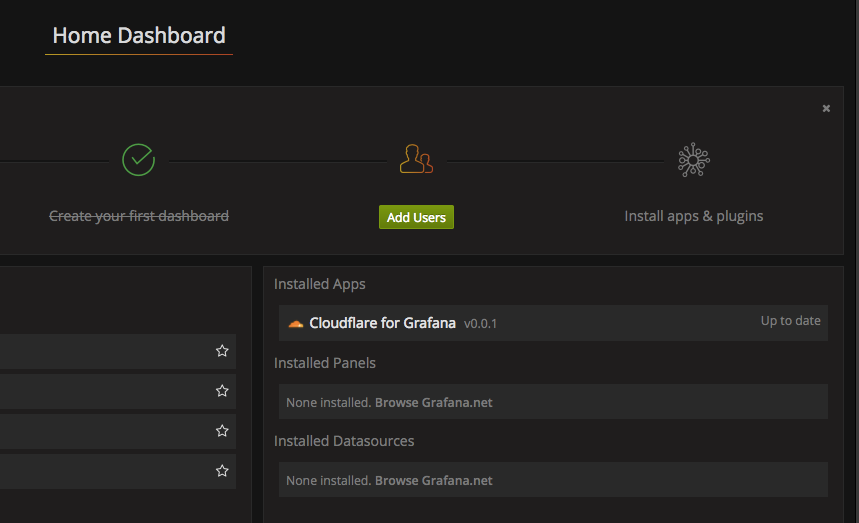
3. Now when you launch Grafana, Cloudflare for Grafana will appear on the home screen under installed apps.
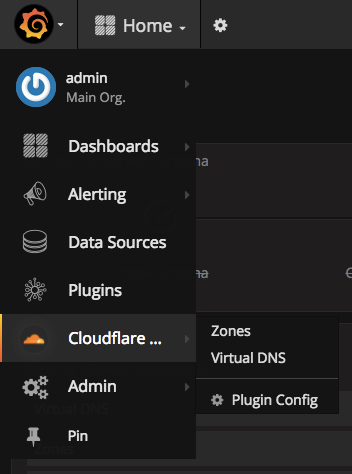
4. Click on the main Grafana icon in the top left corner and hover over the Cloudflare Plugin row and click on Plugin Config.
5. This will take you to the Plugin Config page. We highly recommend that you generate an API token for this app. Please make sure the token has the following permissions:
- Account / Account Settings / Read
- Account / DNS Firewall / Read
- Zone / Zone / Read
- Zone / Analytics / Read
Alternatively, you may authenticate with your email address and legacy API key.
6. Now that you have configured the Cloudflare Grafana plugin with your account details, you can go to the main menu at the top and choose Cloudflare Grafana App > Zones or Cloudflare Grafana App > Virtual DNS if you are a Virtual DNS user.
Note: If you are running Grafana behind Cloudflare, to use the Grafana Cloudflare App you will need to grey cloud (in the DNS editor) the Grafana subdomain so that it does not route through Cloudflare. Otherwise you will receive the error: “DNS points to prohibited IP”.
7. To confirm if you are receiving data, we recommend to check first in the Cloudflare dashboard, when you need to gather the DNS Analytics.
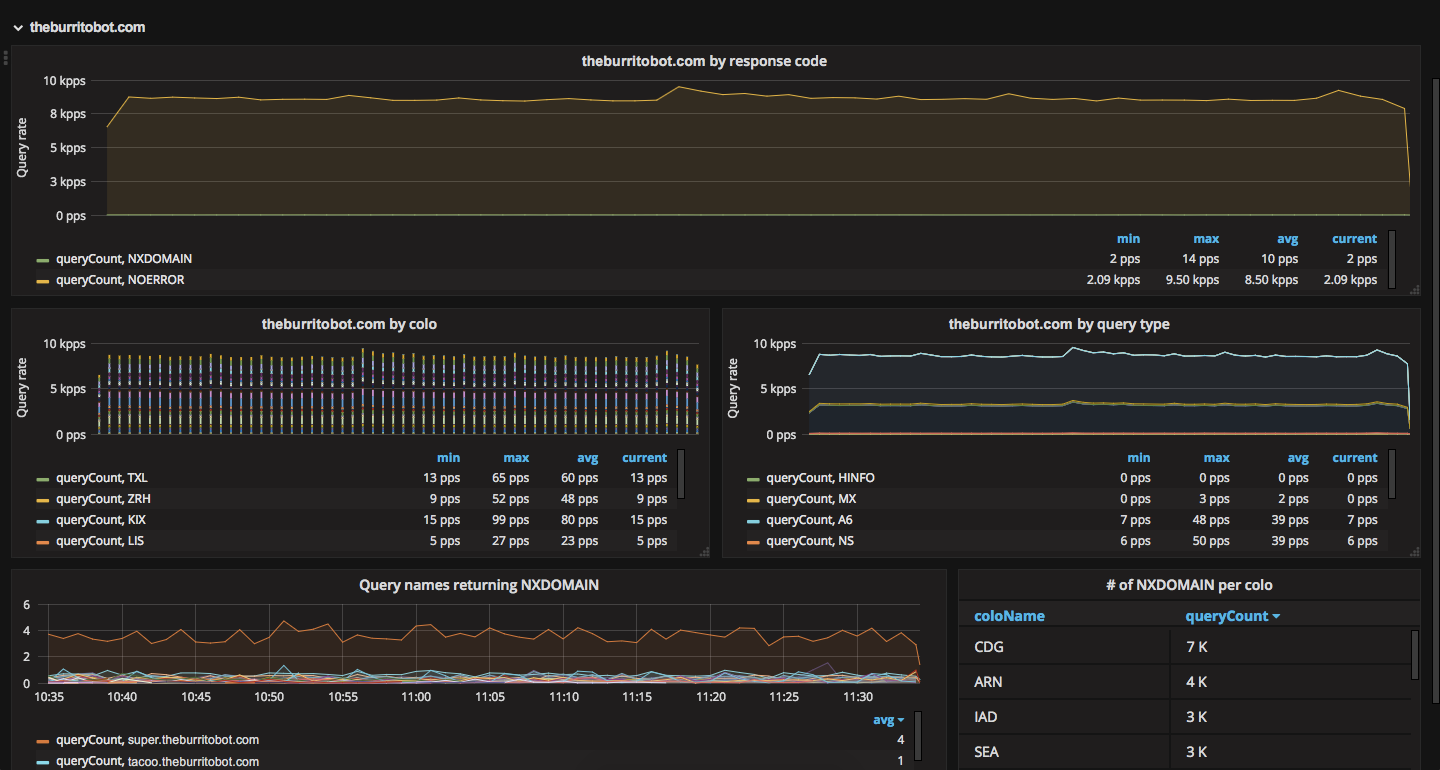
What can different plans see?
Different Cloudflare plans have access to different levels of data.
Free zones: # of queries per response code
Pro zones: # of queries per colo
Business zones: # of queries per response code and # of queries per record type
Enterprise zones: # of queries per query name
You can upgrade plans in your Cloudflare account dashboard here: https://www.cloudflare.com/a/overview/
Adding new panels with the Cloudflare Grafana Plugin
You can use the Cloudflare Grafana plugin to add your own panels to your Grafana dashboards.
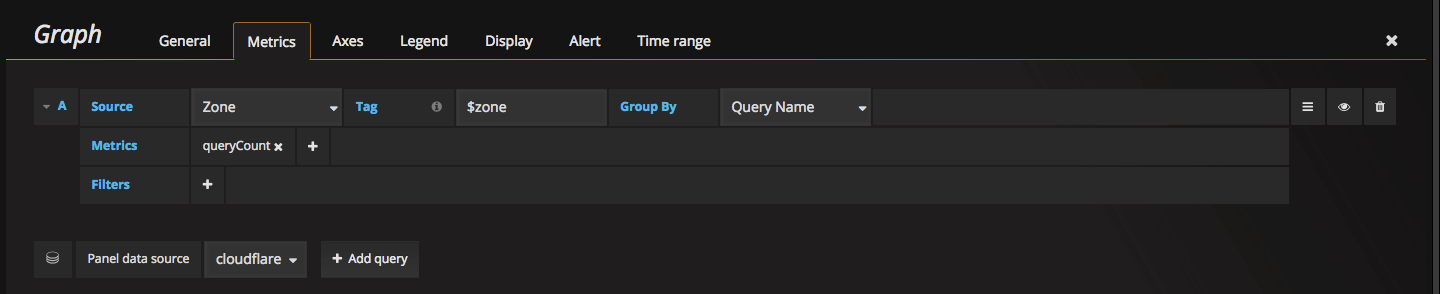
When you are creating a new panel, from Panel Data Source, choose Cloudflare.
For DNS
Use the following fields:
Source: Zone
Tag: $zone
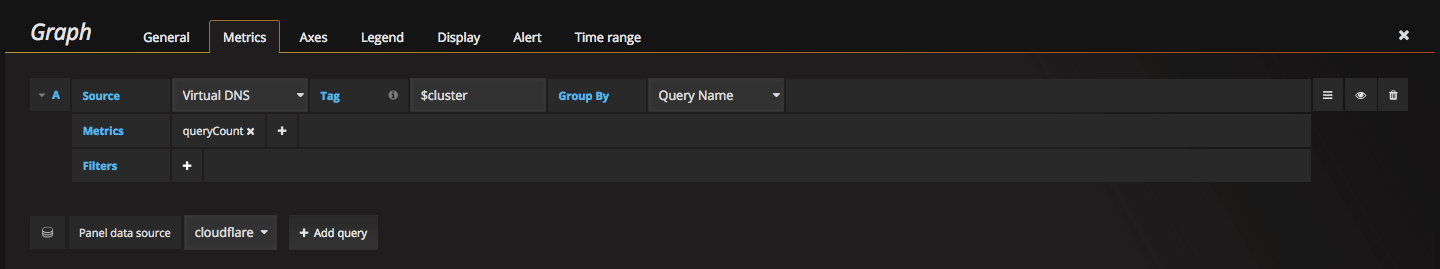
For Virtual DNS
Use the following fields:
Source: Virtual DNS
Tag: $cluster
Troubleshooting
1. “DNS points to prohibited IP” Error
This means there’s a loop created between Grafana and Cloudflare. To fix, you will need to “grey cloud” your grafana dashboard in the Cloudflare DNS dashboard (click on the orange cloud next to the DNS entry for the subdomain hosting your Grafana dashboard).