Security Analytics
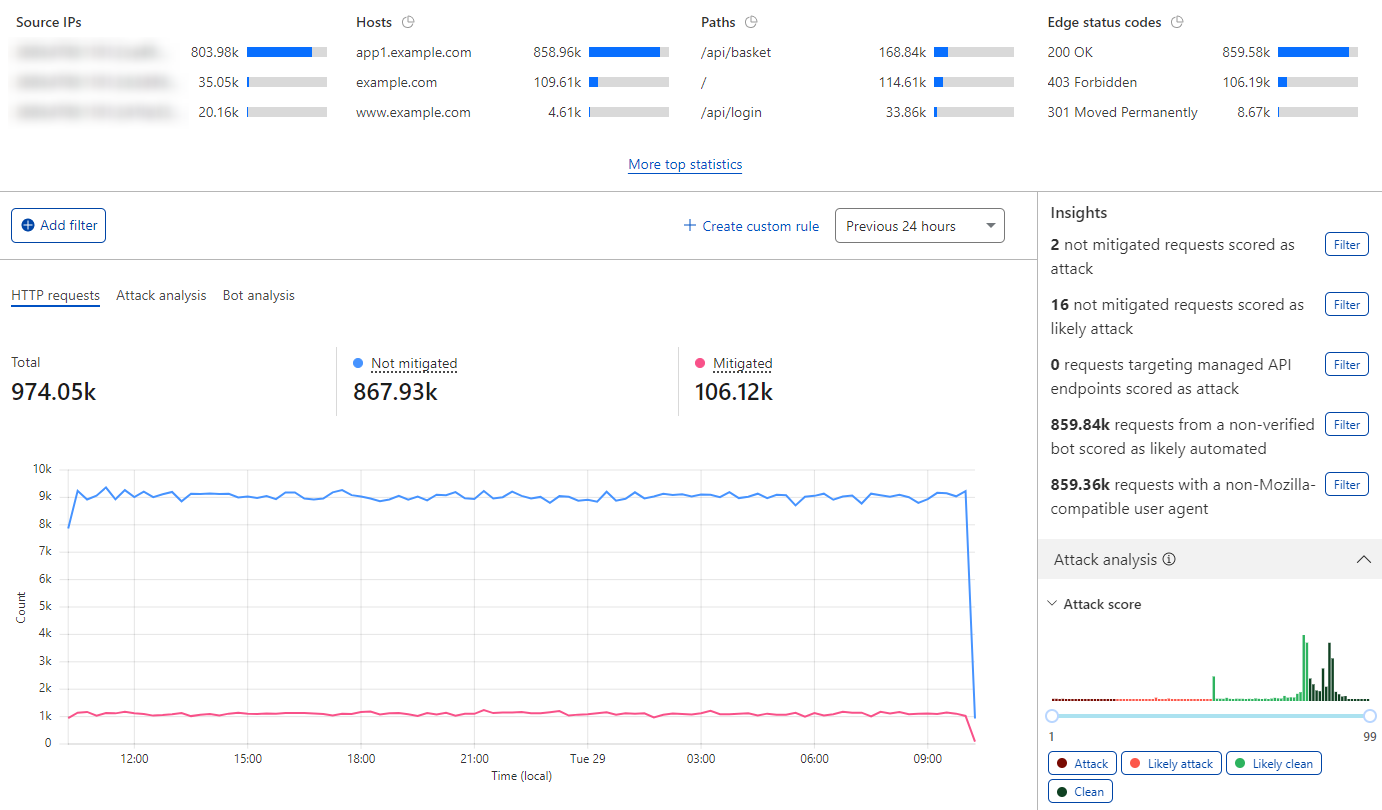
The Security Analytics dashboard displays information about all incoming HTTP requests for your domain, including requests not handled by Cloudflare security products.
In the dashboard you can visualize which traffic is being mitigated by Cloudflare, review several security-related statistics about incoming requests (such as bot score, attack scores, and uploaded content scanning results), and check which requests are reaching the origin server or being handled directly by Cloudflare.
Use Security Analytics to:
- View the traffic distribution for your domain.
- Analyze suspicious traffic and create tailored WAF custom rules based on applied filters.
- Understand which traffic is being mitigated by Cloudflare security products.
- Learn more about Cloudflare’s security scores (attack, bot, content scanning) with real data.
If you need to modify existing security-related rules you already configured, consider also using the Security Events dashboard. This dashboard displays information about requests affected by Cloudflare security products.
Access
To use Security Analytics:
-
Log in to the Cloudflare dashboard and select your account.
-
Go to the account or zone dashboard:
- For the zone dashboard, select your domain and go to Security > Analytics.
- For the account dashboard, go to Security Center > Security Analytics.

Adjusting displayed data
Apply filters
Adjust the scope of analytics by manually entering filter conditions. You can also select Filter or Exclude to filter by a field value. These buttons appear when you hover the analytics data legend.
To manually add a filter:
- Select Add filter.
- Select a field, an operator, and a value. For example, to filter events by source IP address, select the Source IP field, select the equals operator, and enter the IP address.
- Select Apply.
Take the following into account when entering filter values:
- Do not add quotes around values.
- Do not enter the
ASprefix when entering ASN numbers. For example, enter1423instead ofAS1423. - Wildcards are not supported.
Select time frame
Select the time frame you wish to analyze from the Previous 24 hours drop-down list.
Create custom rule from current filters
To create a WAF custom rule with an expression based on the filters you applied in Security Analytics, select Create custom rule.
Main dashboard areas
Top statistics
This section presents top statistics about incoming requests highlighting relevant properties commonly used when performing a security analysis.
You can filter or exclude some of the top values by selecting Filter or Exclude next to each value.
To display additional top statistics, select More top statistics.
Insights
The provided insights show statistics for commonly used filters when doing security analyses, without immediately applying these filters to the displayed data.
If you find a high value in one or more insights, this can mean that there is a set of suspicious requests that you should investigate. Additionally, these insights are a good starting point for applying a first set of filters to the dashboard.
To apply the filters for an insight to the data displayed in the Security Analytics dashboard, select Filter next to the insight.
Score-based analyses
The Attack analysis, Bot analysis, and Uploaded content analysis sections display statistics related to WAF attack scores, bot scores, and WAF content scanning scores of incoming requests for the selected time frame.
You can examine different traffic segments according to the current metric (attack, bot, or content scanning). To apply score filters for different segments, select the buttons below the traffic chart. For example, select Likely attack under Attack analysis to filter requests that are likely an attack (requests with WAF attack score values between 21 and 50).
Additionally, you can use the slider tool below the chart to filter incoming requests according to the current metric. This allows you to filter traffic groups outside the predefined segments.
Main chart
The main chart displays the following data for the selected time frame, according to the selected tab:
- HTTP requests: Requests mitigated by a Cloudflare security product and requests that were not mitigated. Mitigated requests include requests blocked or challenged by Cloudflare’s application security products such as the WAF and HTTP DDoS protection. Unmitigated requests include requests handled using one of the following actions: Log, Skip, Allow.
- Attack analysis: WAF attack score analysis of incoming requests, classifying them as Clean, Likely clean, Likely attack, or Attack.
- Bot analysis: Bot score analysis of incoming requests, classifying them as Automated, Likely automated, or Likely human.
Sampled logs
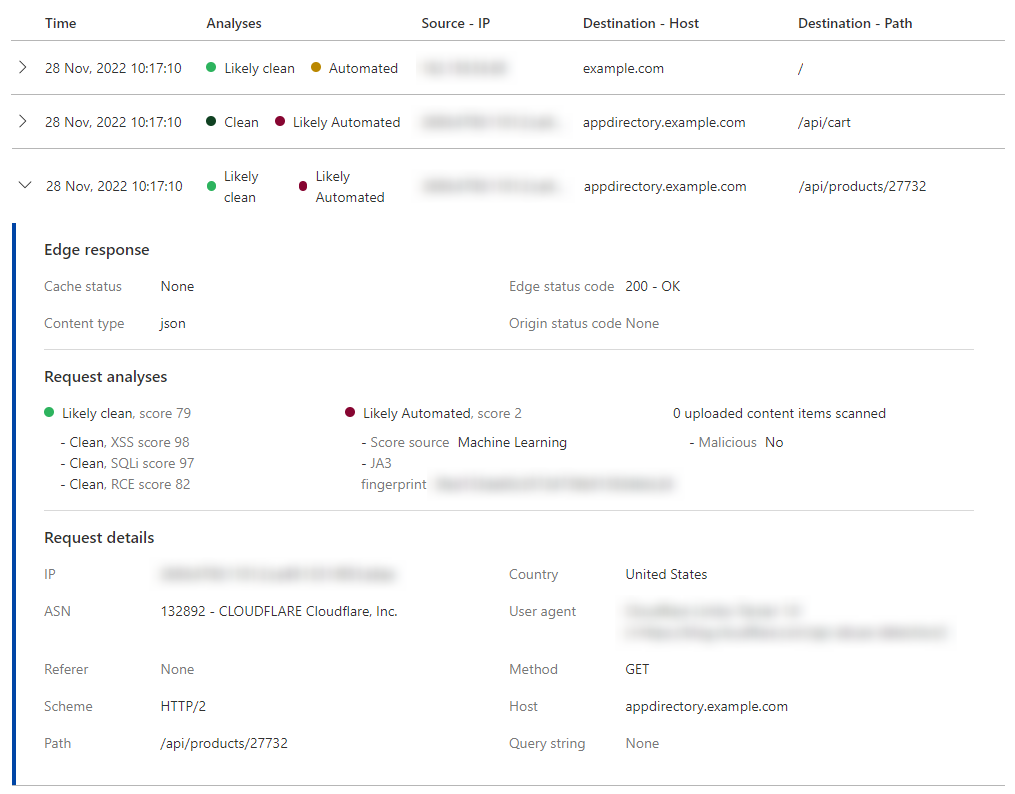
This section contains detailed log information for individual (sampled) requests in the selected time frame.

The displayed information includes:
- Cache status
- Status code returned by the origin server to Cloudflare (in case of a cache miss)
- Status code returned by Cloudflare to the client
- Security scores for the request (attack, bot, uploaded content scanning)
- Request properties
Final remarks
The Security Analytics dashboard uses sampled data. Most information in the dashboard is obtained from httpRequestsAdaptiveGroups and httpRequestsAdaptive GraphQL nodes. For more information on working directly with GraphQL datasets, refer to Datasets (tables).